
Your bookkeeping says you made money this month. Your bank account says otherwise. Payroll is coming up, rent is due, sales looked solid, and yet cash feels tight.
That disconnect is where many small business owners lose confidence in their numbers. They look at the profit and loss statement once a year for taxes, then go back to running the business by instinct. That's a mistake. P and L analysis is how you turn a report into a decision tool. It tells you whether pricing is working, whether overhead is creeping up, and whether growth is helping or hurting.
Most owners don't need more reports. They need to read the right report correctly.
Table of Contents
- The Profitable Business with an Empty Bank Account
- Decoding Your P&L Statement Anatomy
- Your Step by Step P&L Analysis Method
- P&L Analysis in Action A Worked Example
- Beyond the Basics Advanced Insights and Benchmarking
- Common Pitfalls Why Profit Does Not Equal Cash
- When to Partner With a Tax and Accounting Advisor
The Profitable Business with an Empty Bank Account
You sell well, your P&L shows a profit, and you still feel broke. That isn't unusual. It's one of the most common financial puzzles in a small business.

A lot of owners assume profit means cash should be piling up. It doesn't. Profit measures performance over a period. Cash measures what's available today. If you don't separate those two ideas, you'll keep getting blindsided by tax payments, supplier bills, and payroll.
That's why a monthly P&L deserves your attention. Not because your accountant wants cleaner books, but because you need to know whether the business is generating healthy margins or just staying busy. Activity is not the same as profit. Profit is not the same as cash. If you mix those up, growth can make your problems worse.
Practical rule: Review your P&L every month, then compare it with your receivables, payables, and bank balance before making any hiring or spending decision.
When owners get serious about p and l analysis, they stop asking vague questions like “Are we doing okay?” and start asking useful ones:
- Pricing: Are you charging enough to cover direct costs and still leave room for overhead?
- Expenses: Did software, labor, or marketing creep up without a matching return?
- Timing: Did you record income that hasn't hit the bank yet?
- Planning: Are you using a cash forecast, like a 13-week cash flow process, to catch shortfalls before they become emergencies?
The P&L is not a tax form in disguise. It's your operating scorecard. Used well, it shows where profit is created, where it leaks out, and why a business that looks healthy on paper can still feel financially strained.
Decoding Your P&L Statement Anatomy
Most P&Ls are easier to understand than owners think. The problem isn't complexity. The problem is that people glance at the bottom line and skip the layers above it.

Start at the top and work down
Think of the statement like a business recipe.
You start with revenue, which is the total sales generated during the period. Then you subtract cost of goods sold, or COGS. That gives you gross profit. From there, you subtract operating expenses such as payroll, rent, marketing, subscriptions, and admin costs. What remains is operating income. After interest, taxes, and other non-operating items, you arrive at net income.
That flow matters because each layer answers a different question. Revenue tells you what came in. Gross profit tells you whether the thing you sell is economically sound. Operating income tells you whether the company is managed efficiently. Net income tells you what was left after everything else.
If you need a cleaner breakdown of direct production costs, this guide on what cost of goods sold means helps clarify where many businesses misclassify expenses.
What each layer tells you
Owners often misread their P&L because they focus on sales and ignore structure. A better approach is to ask what each section is signaling.
- Revenue: Sales volume can rise while profitability weakens. More sales doesn't automatically mean a stronger business.
- COGS: If direct costs climb too fast, gross profit gets squeezed. That usually points to pricing issues, waste, or weak purchasing discipline.
- Operating expenses: Bloat often manifests here. Software sprawl, overstaffing, and scattered marketing spend can subtly drag down the business.
- Net income: Net income represents the final output, but it's the worst place to begin analysis because it combines many moving parts.
Read the P&L from the middle, not just the bottom. Gross profit and operating income usually tell you where the real problem starts.
For sole proprietors who want a simpler owner-focused explanation, Receipt Router's P&L guidance for sole traders is a useful companion. It's especially helpful if your reporting still feels too accounting-heavy.
A good P&L tells a story. If revenue is up, gross profit is flat, and operating income is down, the story isn't “growth.” The story is that costs are eating the business alive.
Your Step by Step P&L Analysis Method
A P&L only becomes useful when you analyze it the same way every month. Random glances won't do it. You need a repeatable method.
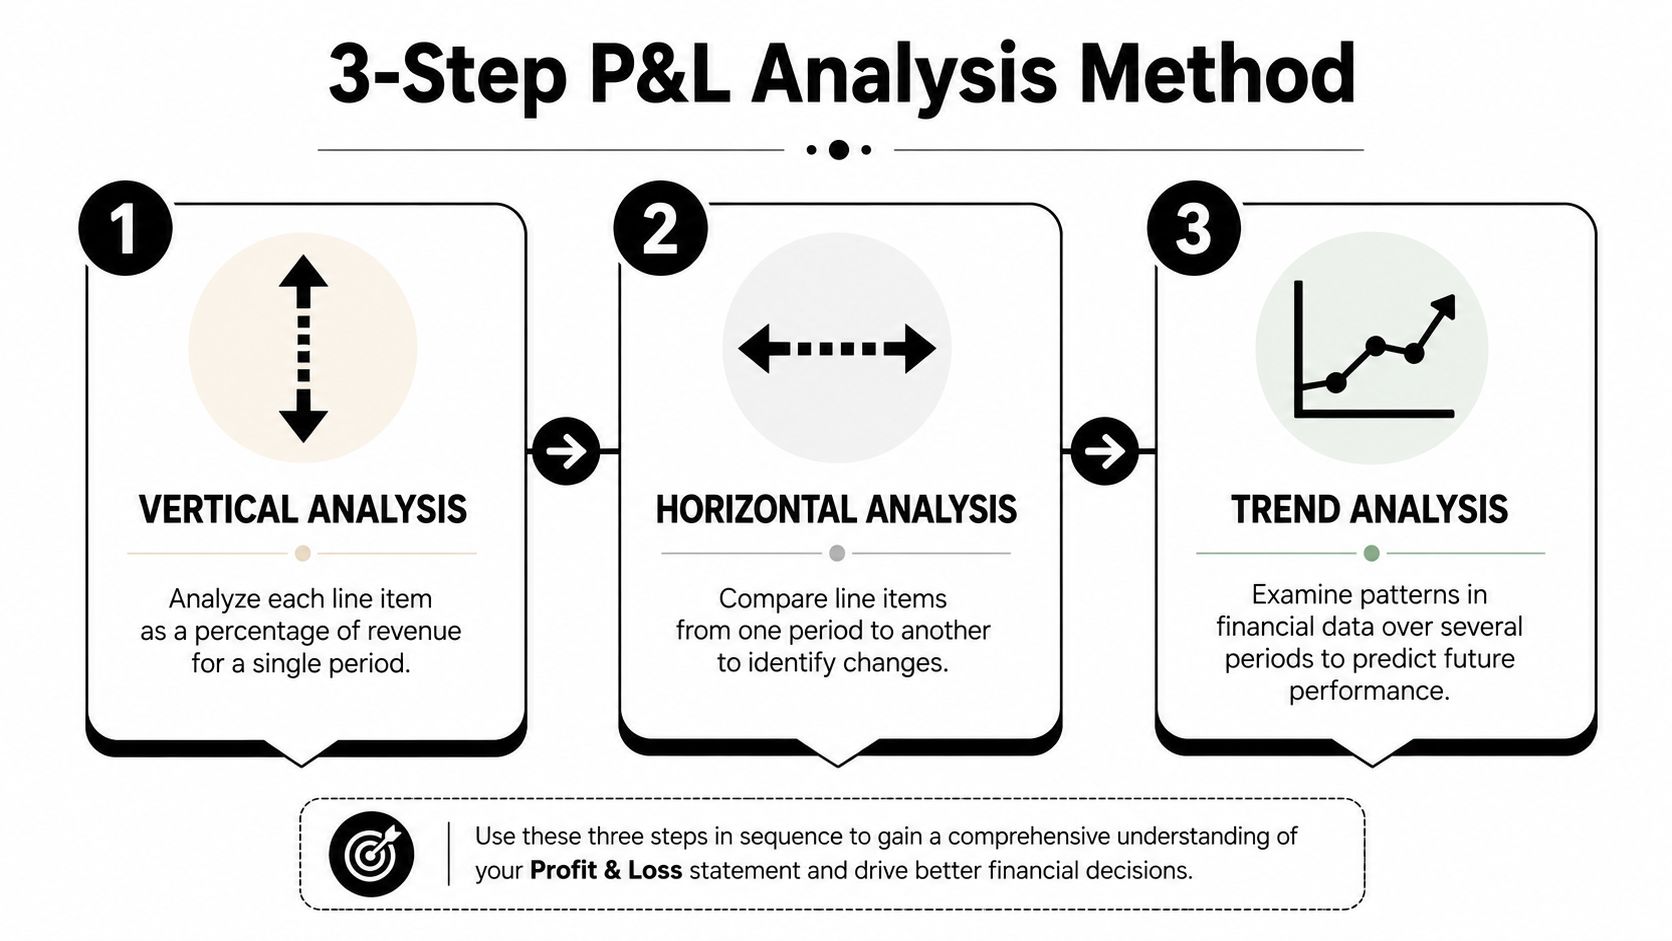
A profit and loss statement is one of the core financial reports used to measure profitability over a defined period, and it's commonly prepared monthly, quarterly, or annually. That cadence matters because it lets managers compare revenue, costs, and expenses across time instead of relying on one snapshot. In practice, p and l analysis often includes horizontal comparisons, margin review, and benchmarking. It also turns raw transactions into ratios like net income as a percentage of sales, calculated by dividing net income by net revenue and multiplying by 100, which makes period-to-period comparison more useful when revenue changes materially (NetSuite's explanation of profit and loss statements).
Step one with vertical analysis
Vertical analysis means expressing each line item as a percentage of revenue. This is one of the fastest ways to understand your cost structure.
If revenue is your base, every other line becomes easier to judge. You can see whether payroll is taking too much of every sales dollar. You can see whether advertising is staying in line. You can see whether net income is improving because the business is more efficient or just because revenue temporarily jumped.
Use vertical analysis when you want clarity inside a single period.
- Gross profit percentage: Shows how much revenue remains after direct costs.
- Operating expense percentages: Show how much of each sales dollar goes to labor, rent, software, and similar overhead.
- Net income percentage: Shows what the business keeps.
Step two with horizontal analysis
Horizontal analysis compares one period to another. Month to month works. Quarter to quarter works. Year over year works. The point is to identify movement.
Patterns emerge. Revenue might be rising, but so might refunds. Payroll might be stable, but contractor costs may be climbing. Marketing might look expensive in one month but sensible over a longer run if it supports stronger sales and margin quality.
Don't analyze a single month in isolation if your business has seasonality, project billing swings, or inventory timing issues.
A simple monthly close process makes this easier. If your reports are delayed or inconsistent, fix that first. This resource on how to prepare financial statements is a good starting point if your books aren't producing clean, comparable statements.
Step three with margin review
Margins are the vital signs of the business. They strip away noise and force discipline.
Look at three levels:
- Gross margin tells you whether your product or service model works.
- Operating margin shows whether overhead is under control.
- Net margin shows what survives after everything.
Review these margins every month. Then ask one hard question. Are profits expanding faster than costs, or are expenses eroding the gains from higher sales? That's the question that matters.
P&L Analysis in Action A Worked Example
Talking about margins is easy. Reading a live set of numbers is where owners usually freeze. So let's use a simple fictional example for a San Diego e-commerce business and focus on interpretation, not accounting theater.
A simple example from an e commerce business
Below is a sample layout you can copy into Excel or QuickBooks reporting exports. The exact figures will depend on your business, but the structure is what matters.
| Line Item | Q1 2026 ($) | Q1 (% of Revenue) | Q2 2026 ($) | Q2 (% of Revenue) | Q-o-Q Growth (%) |
|---|---|---|---|---|---|
| Revenue | [enter amount] | [base] | [enter amount] | [base] | [compare periods] |
| Cost of Goods Sold | [enter amount] | [divide by revenue] | [enter amount] | [divide by revenue] | [compare periods] |
| Gross Profit | [revenue less COGS] | [divide by revenue] | [revenue less COGS] | [divide by revenue] | [compare periods] |
| Operating Expenses | [enter amount] | [divide by revenue] | [enter amount] | [divide by revenue] | [compare periods] |
| Operating Income | [gross profit less operating expenses] | [divide by revenue] | [gross profit less operating expenses] | [divide by revenue] | [compare periods] |
| Other Income and Expenses | [enter amount] | [divide by revenue] | [enter amount] | [divide by revenue] | [compare periods] |
| Net Income | [final amount] | [divide by revenue] | [final amount] | [divide by revenue] | [compare periods] |
Here's how to use it. Start with revenue and COGS. If Q2 revenue rises but COGS rises faster, gross margin tightens. That's not always a crisis, but it does demand a reason. Discounting, shipping changes, supplier price increases, and product mix shifts are common causes.
Then move to operating expenses. If marketing expense increases and revenue increases with it, ask a second question. Did gross profit also improve, or did you make more low-margin sales? Growth that weakens margin quality isn't healthy growth.
What the numbers actually mean
A worked example becomes valuable when you interpret movement line by line.
Consider a few common scenarios:
- Revenue up, gross margin down: You may be discounting too aggressively or selling more low-margin items.
- Gross margin steady, operating income down: Your overhead is bloated. The problem likely isn't the product. It's the way the company is being run.
- Operating income up, net income weak: Interest, taxes, or other non-operating items may be dragging down the bottom line.
- Revenue flat, net income stronger: Cost control may be improving. That can be a healthy sign if it doesn't come from starving the business.
The right question isn't “Did profit go up?” It's “Which layer changed, and why?”
Owners often jump straight to cutting expenses. Sometimes that's right. Sometimes the fix is raising prices, tightening purchasing, changing product mix, or removing work that looks busy but doesn't pay.
The discipline here is simple. Compare the periods. Convert the lines to percentages. Then write one sentence explaining each meaningful change. If you can't explain the change, you don't understand the business well enough yet.
Beyond the Basics Advanced Insights and Benchmarking
Internal analysis tells you how you're changing. Benchmarking tells you whether those changes are good enough.
Why peer comparison matters
Benchmarking P&L margins against peers is one of the most actionable expert-level uses of the statement. Comparing gross margin, operating margin, EBIT margin, and net profit margin helps determine whether a business is outperforming or merely keeping pace. It also helps identify structural advantages such as pricing power, procurement efficiency, or scalable overhead. Analysts also look at recurring-revenue mix, expense ratios, and trends in how sales growth impacts operating income to judge sustainability. If sales grow faster than SG&A, operating margins should expand. If gross margin is steady but operating margin weakens, the problem is usually overhead rather than product economics (video explanation on margin benchmarking and operating leverage).
That matters because owners often normalize bad performance. They assume “that's just the industry.” Sometimes it is. Often it isn't.
If your gross margin trails peers, look first at pricing, discounting, purchasing discipline, and job costing. If your gross margin is fine but operating margin lags, focus on payroll design, software creep, rent burden, admin layers, and management overhead.
What to compare beyond revenue
Revenue is the least interesting comparison point by itself. Better questions include:
- Gross margin quality: Are you keeping enough after direct costs?
- Operating scalability: Does overhead grow slower than sales, or does every new dollar of revenue drag more expense behind it?
- Expense ratios: Are sales, general, and administrative costs reasonable for your size and model?
- Mix of revenue: Is recurring work supporting stability, or are results overly dependent on one-off wins?
If you want a clearer way to study patterns across periods before benchmarking, PlotStudio AI's guide to time series is useful. It helps frame trend review in a more disciplined way, especially when your monthly results swing.
Benchmarking isn't about chasing someone else's numbers. It's about identifying whether your economics are structurally weak, operationally sloppy, or strong. Once you know which one you're dealing with, strategy gets much easier.
Common Pitfalls Why Profit Does Not Equal Cash
Your P&L can show a profit while your bank balance shrinks. That doesn't mean the report is wrong. It means you're looking at two different realities.
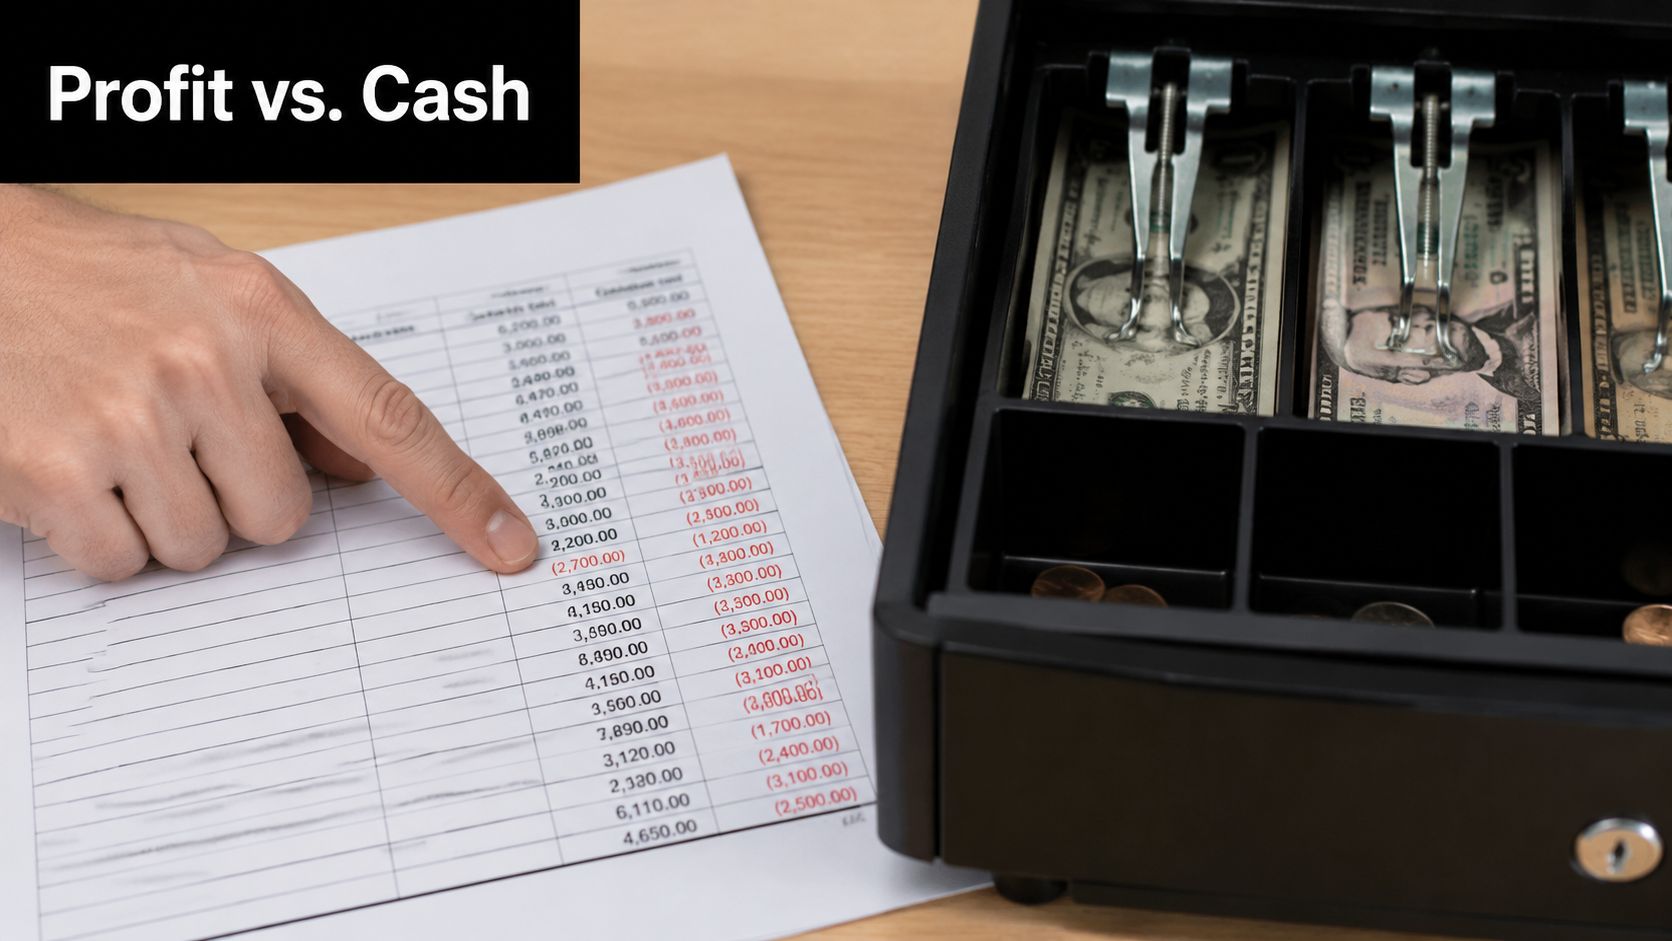
A frequently underexplored issue in P&L content is cash versus profit timing. Many guides explain revenue, expenses, margins, and horizontal or vertical analysis, but they don't answer the practical question of why a business can show profit on the P&L while still run short on cash. Cash collection timing, working-capital movements, and non-cash items often sit outside standard explainers. That gap has mattered more in the recent higher-rate environment because interest expense and financing strain can make profit look acceptable while liquidity weakens (Paro's discussion of the cash versus profit gap).
Three reasons cash lags profit
The first reason is timing. You may record a sale before the customer pays you. The P&L shows revenue. Your bank account shows nothing yet.
The second is non-cash expense. Depreciation reduces accounting profit, but it doesn't require a current cash payment. That means some expenses affect profit without draining the bank in the same period.
The third is balance sheet movement. Inventory purchases, loan principal payments, and owner distributions can use cash without hitting the P&L the way owners expect. Consequently, many profitable businesses get squeezed. The P&L says operations worked. The cash account says working capital got tied up somewhere else.
A profitable month can still create cash stress if customers pay slowly, inventory builds, or debt payments absorb the surplus.
What to watch every month
You don't solve this by staring harder at net income. You solve it by pairing the P&L with a few practical checks:
- Receivables aging: Which customers haven't paid, and how old are those balances?
- Inventory levels: Are you buying faster than you're selling?
- Debt service: Are loan payments consuming cash that your P&L doesn't make obvious?
- Owner draws: Are you pulling more out of the business than operations can support?
If cash management is a recurring pain point, Resolut's article on mastering positive cash flow is a solid practical read. It complements P&L review by forcing attention onto timing and liquidity, where many owners get hurt.
When to Partner With a Tax and Accounting Advisor
DIY analysis is useful up to a point. Then it becomes expensive.
If your business is adding locations, buying equipment, carrying more inventory, hiring quickly, dealing with sales tax in multiple states, or struggling to close the books cleanly each month, you need more than bookkeeping. You need interpretation. You need someone to tell you whether a margin problem is operational, tax-related, classification-related, or a cash-flow warning.
A good advisor also matters when the numbers look contradictory. Revenue is rising but cash is tight. Gross profit looks fine but net income is disappointing. The owner is working harder, yet the business feels less stable. Those aren't software problems. They're decision problems.
Bring in help when any of these are true:
- Your reports arrive late: Old numbers don't support current decisions.
- Your chart of accounts is messy: Bad classification leads to bad conclusions.
- You're making major moves: Expansion, financing, restructuring, and entity planning all need clean financial interpretation.
- You're spending owner time on bookkeeping: That's rarely the highest-value use of your attention.
The right advisor won't just hand you statements. They'll help you use them.
If you want help turning messy books into decisions you can trust, Allied Tax Advisors can help you connect your P&L, cash flow, tax planning, and day-to-day business choices. That's the difference between looking at reports and operating your business from them.