
You close the month thinking, “We were slammed. We must have made money.”
Orders went out. Clients paid invoices, or at least promised to. Your team stayed busy. You spent on supplies, software, payroll, shipping, ads, and the dozen little charges that hit your card when you're not looking. Then tax season or a lender asks for your numbers, and suddenly one question matters more than all the activity: Did the business earn a profit?
That's where a business profit and loss statement becomes useful. Not as a form you hand to your accountant and forget, but as the document that tells you whether all that effort is producing a healthy business. And for many owners, there's a second, more uncomfortable question hiding underneath it: if the P&L says you made money, why does the bank balance still feel tight?
A good P&L answers the first question. A smart reading of it helps you avoid getting blindsided by the second.
Table of Contents
- Are You Busy or Are You Profitable
- What Is a Business Profit and Loss Statement
- The Anatomy of a Profit and Loss Statement
- How to Prepare Your P&L Statement
- Reading Between the Lines A Sample P&L Walkthrough
- The Most Dangerous P&L Mistake You Can Make
- Using Your P&L for Tax Planning and Growth
Are You Busy or Are You Profitable
A lot of small business owners live in a strange place financially. They're overloaded with work and under-informed on results.
Take a simple example. A contractor finishes jobs all month, answers calls late at night, buys materials, pays a helper, and sees money coming in. From the outside, the business looks healthy. But when the owner tries to answer basic questions, things get fuzzy. Which jobs made money? Did overhead eat up the gain? Is the business improving or just staying busy?
That confusion is normal. Activity and profitability are not the same thing.
What owners usually feel first
Individuals typically don't start by asking for a P&L. They start with symptoms:
- The bank account feels unpredictable. Some weeks look fine, then bills stack up fast.
- Sales seem solid. But there's no confidence about what's left after costs.
- Tax time feels stressful. Records exist, but they don't tell a clean story.
- Big decisions get delayed. Hiring, pricing, and spending feel risky because the numbers aren't clear.
Practical rule: If you can't quickly explain where your profit comes from, you're probably managing from motion instead of measurement.
A business profit and loss statement gives you a way out of that fog. It doesn't care how hard you worked. It shows what the business earned, what it spent, and whether there was a profit or a loss for a specific period.
Why this matters more than most owners think
Without that view, owners tend to make decisions based on mood. A busy month feels profitable. A slow month feels dangerous. Neither feeling is reliable.
A clean P&L acts like a compass. It tells you whether your pricing is working, whether direct costs are creeping up, whether overhead is under control, and whether the business is moving in the right direction. It also gives your tax preparer, lender, or advisor something far more useful than a stack of uncategorized transactions.
Once you start reading it regularly, you stop guessing. That alone changes how you run the business.
What Is a Business Profit and Loss Statement
Think of a business profit and loss statement like a scoreboard for a defined stretch of time. Not your whole business history. Not today's bank balance. Just one period, such as a month, quarter, or year.
It shows what came in and what went out during that period. The result is either a profit or a loss.

A profit and loss statement, also called an income statement, summarizes a business's revenues, costs, and expenses over a specific period. It gives you a dynamic view of financial performance over time, unlike a balance sheet, which shows financial position at a single point in time, as explained in Bold Group's overview of how to analyze a profit and loss statement.
The simplest way to understand it
If you've ever run a household budget, you already understand the basic idea.
Money earned
minus
money spent
equals
what's left
For a business, the structure is more detailed because not all expenses mean the same thing. The cost to produce what you sell is different from rent. Rent is different from loan interest. Taxes are different from payroll. A P&L keeps those categories separate so you can see where profit is created and where it disappears.
What question it answers
The P&L primarily answers one question:
Did this business make money during this period?
That sounds simple, but it's one of the most important questions in business. If you can't answer it clearly every month, you're making decisions in the dark.
Here's what a P&L is not:
- Not a balance sheet. A balance sheet is a snapshot of what you own and owe at one moment.
- Not a cash flow statement. A cash flow statement tracks the movement of cash.
- Not your bank feed. Bank activity is raw data. A P&L is organized financial meaning.
Why owners confuse it with cash
Many people frequently misunderstand this concept. They look at cash in the bank and assume that's profit. Or they see profit on a report and assume the cash is there.
Those are different questions. The P&L tells you performance. Cash flow tells you liquidity. You need both, but if you want to know whether your core business model is working, the P&L is the place to start.
The Anatomy of a Profit and Loss Statement
A good P&L reads from top to bottom like a story. Revenue starts at the top. Net income lands at the bottom. Everything in between explains what happened.
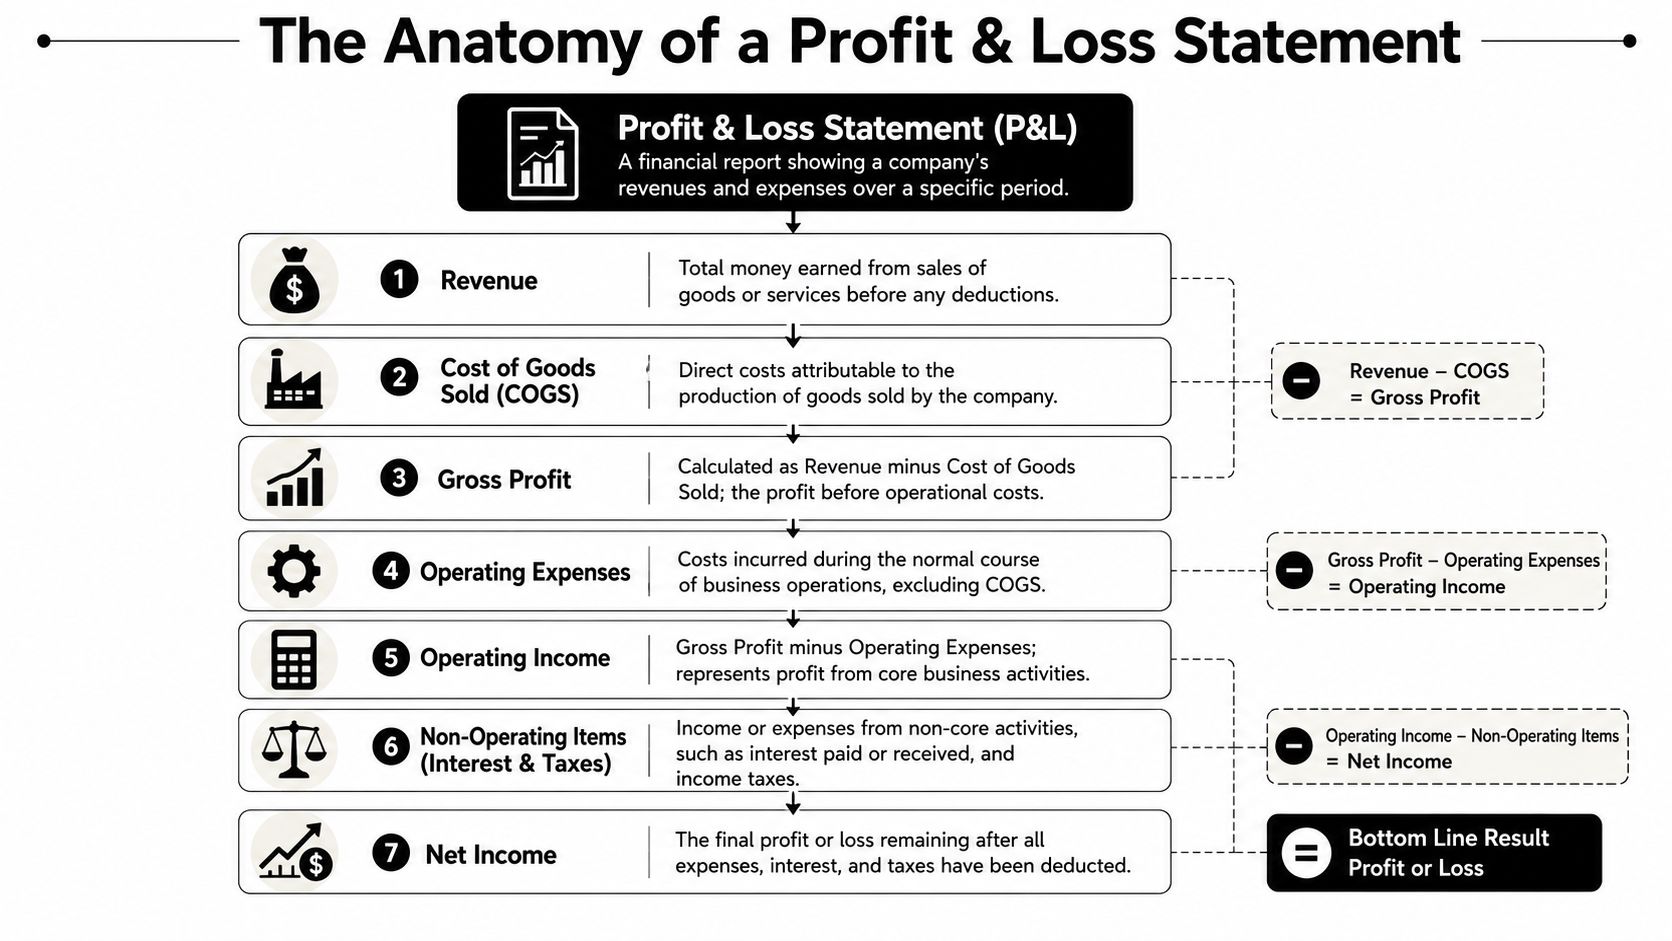
Expense separation matters. COGS, operating expenses, and non-operating expenses should not be mixed together. Subtracting COGS from revenue gives gross profit, and subtracting operating expenses from gross profit gives operating profit, as described in QuickBooks' guide to profit and loss reporting.
Revenue at the top
Revenue is the money your business earned from selling goods or services during the period. People often call this the top line.
If you sell products, revenue comes from product sales. If you run a service business, it comes from client work. Before you rely on the number, make sure it reflects net revenue rather than inflated sales figures that ignore returns or discounts.
For owners with multiple business lines, this is often where strategy starts. If one category drives most of your revenue, you'll want separate visibility by product, service, or customer group. The same thinking shows up in investing. When someone studies a property's income potential using real estate cap rate analysis, they're trying to understand return based on income and costs, not just headline activity.
Cost of goods sold and gross profit
Cost of goods sold (COGS) includes the direct costs required to deliver what you sell.
For a retailer, that may be inventory. For a manufacturer, raw materials and direct production labor. For some service businesses, it may include labor directly tied to client delivery. COGS does not include general overhead like office rent or admin salaries.
Gross profit is the first major checkpoint:
- Revenue minus COGS equals Gross Profit
If gross profit is weak, your pricing, purchasing, or delivery costs may need attention. If you're unsure what belongs in direct costs, this guide on how to calculate cost of goods sold is a useful reference.
Operating expenses and operating income
After gross profit, the statement moves into the costs of running the business itself. These are operating expenses.
Common examples include:
- Rent and utilities: The cost to keep your space functioning
- Payroll and salaries: Staff who support the business overall
- Marketing: Advertising, promotions, and agency fees
- Software and admin tools: QuickBooks, payroll systems, subscriptions
- Professional fees: Accounting, legal, and consultants
Subtract those operating expenses from gross profit and you get operating income. This number matters because it shows whether the core business is working before financing and taxes enter the picture.
If operating income is thin, the business may be selling enough but carrying too much overhead.
Non-operating items and the bottom line
The final section captures items outside normal operations, including interest and taxes. These don't describe the strength of your product or service. They describe financing choices, tax obligations, and other non-core effects.
A simplified flow looks like this:
| Line item | What it tells you |
|---|---|
| Revenue | What the business earned |
| Less COGS | Direct cost of delivering revenue |
| Gross Profit | Profit before overhead |
| Less Operating Expenses | Cost to run the business |
| Operating Income | Profit from core operations |
| Less Interest and Taxes | Financing and tax impact |
| Net Income | Final profit or loss |
Net income is the bottom line. It's the amount left after all expenses are accounted for. When owners say, “Did we make money?” this is usually the number they mean.
How to Prepare Your P&L Statement
You can prepare a P&L in two main ways. One is manual. The other is through accounting software. Both can work, but they serve different stages of business.

The spreadsheet route
A spreadsheet is often where owners begin. It's cheap, flexible, and familiar.
You list revenue categories, direct costs, operating expenses, and non-operating items. Then you total each section and calculate profit. This approach can be fine for a very simple business with low transaction volume and disciplined bookkeeping.
But spreadsheets have two weaknesses. First, they depend on accurate manual entry. Second, they're only as good as your categories. If you mix owner draws with payroll, or put direct costs into overhead, your report may look polished and still be wrong.
Using accounting software
For most businesses, software is the better path. QuickBooks is a common example because it pulls transactions from your accounting records and generates reports based on how those transactions are categorized.
That doesn't mean the software “does the thinking.” You still need a clean chart of accounts and good bookkeeping habits. But once those are in place, producing a business profit and loss statement becomes much faster and more consistent.
If you want a broader view of the reporting process, this resource on how to prepare financial statements can help connect the P&L to your other core reports.
A practical routine that works
One report by itself doesn't tell you much. For effective financial management, the P&L should be compared to the prior two periods and to your budget forecast, because a single number in isolation provides almost no actionable insight, according to Bench's explanation of profit and loss statement analysis.
A simple monthly routine looks like this:
- Close the books promptly. Make sure income and expenses for the month are recorded.
- Review category accuracy. Check whether costs landed in the right buckets.
- Run the current P&L. Look at revenue, gross profit, operating expenses, and net income.
- Compare periods. Read this month beside the prior two periods.
- Compare to budget. Ask where actual results drifted from plan.
- Write down actions. Raise prices, trim subscriptions, renegotiate vendors, or investigate a margin drop.
A P&L is most useful when it leads to a decision, not just a filing cabinet.
Reading Between the Lines A Sample P&L Walkthrough
Reading a P&L gets easier when you stop treating it like a tax document and start treating it like a business story.
Let's use a simple sample for a fictional company. The exact numbers will vary by industry, so focus on the pattern, not on whether any single amount is “good.”
Sample Profit & Loss Statement for Quarter Ended March 31, 2026
| Item | Amount |
|---|---|
| Revenue | [insert business sales for the quarter] |
| Cost of Goods Sold | [insert direct costs tied to those sales] |
| Gross Profit | Revenue minus Cost of Goods Sold |
| Operating Expenses | [insert rent, payroll, marketing, software, and other overhead] |
| Operating Income | Gross Profit minus Operating Expenses |
| Other Income and Other Expenses | [insert non-operating items such as interest or one-time gains/losses] |
| Net Profit Before Taxes | Operating Income plus Other Income minus Other Expenses |
| Income Taxes | [insert taxes for the period] |
| Net Income | Net Profit Before Taxes minus Income Taxes |
Start with the big jumps
Most owners look straight at net income. I'd rather you start higher up.
First, compare revenue to COGS. That tells you whether the work itself is producing enough margin before overhead enters the picture. If sales rise but gross profit doesn't improve, your direct costs may be growing too fast.
Next, compare gross profit to operating expenses. This reveals whether overhead is controlled. A business can have healthy sales and decent direct margins, but still struggle because payroll, software, rent, and marketing consume too much.
Two margin formulas worth knowing
You don't need advanced finance to get value from a P&L. Two simple formulas do a lot of work:
- Gross margin = gross profit divided by revenue
- Net profit margin = net income divided by net revenue multiplied by 100
Those formulas are part of standard P&L analysis, as noted in Bold Group's explanation of key profit and loss metrics.
Gross margin tells you how much of each revenue dollar remains after direct costs. Net profit margin tells you what remains after everything.
A falling gross margin usually points to pricing pressure, higher direct costs, or weaker production efficiency. A falling net margin may point to those same issues, but overhead can also be the culprit.
Questions to ask when you review the sample
Rather than stare at the page, ask practical questions:
- Did revenue grow because of better pricing, more volume, or a mix of both?
- Did direct costs rise faster than sales?
- Are operating expenses increasing because of intentional investment or because costs are drifting?
- Is net income stable, improving, or becoming erratic?
A more detailed review often benefits from side-by-side period analysis. If you want a deeper framework, this guide to P&L analysis is a solid next step.
Why a single month can mislead you
A one-month P&L can be noisy. Seasonality, timing of expenses, and uneven customer billing can distort the picture.
That's why trends matter more than isolated results. Looking across rolling periods often reveals changes before they fully show up in net income. If gross margin keeps slipping for several periods, you've learned something important even before the bottom line takes a major hit.
The Most Dangerous P&L Mistake You Can Make
The biggest mistake is simple. Assuming profit equals cash.
It doesn't.
Most guides miss this gap, even though The Numbers Agency notes that 82% of small businesses fail due to cash flow problems, not lack of profitability. That's why a business can look profitable on paper and still run into trouble paying bills.
How this happens in real life
Suppose you finish a large project in March and send the invoice before month-end. Under accrual accounting, that revenue may appear on the March P&L even if the customer doesn't pay until later.
Your March report can show a profit. But if payroll, rent, taxes, and vendors need cash now, you may still feel squeezed.
The reverse can happen too. You might prepay insurance or software for future months. The cash leaves the bank today, but the expense may be recognized over time. Your cash drops now while the P&L spreads the cost out.
Why the timing gets confusing
At this point, owners start saying, “My accountant says I made money, but I don't see it.”
That may be completely true. The P&L is built to measure performance for a period. The cash flow statement is built to show when cash moved. Both matter. They just answer different questions.
Here's the plain-English version:
- P&L question: Did the business earn a profit in this period?
- Cash flow question: Did enough cash come in to cover what had to be paid?
Profit is not a substitute for liquidity. A profitable business can still get into trouble if cash arrives late and bills come due early.
The discipline that protects you
When you review your P&L, pair it with your cash flow statement and your receivables list. If net income looks healthy but cash is tight, ask why. Are customers paying slowly? Did you buy inventory ahead of demand? Did debt payments rise? Did you prepay a major annual cost?
That habit changes the quality of your decisions. Instead of celebrating profit too early or panicking over a cash dip without context, you can diagnose the actual issue.
Using Your P&L for Tax Planning and Growth
A business profit and loss statement shouldn't live in the past. It should help you make better decisions before year-end, before tax filings, and before major spending choices.
For many owners, especially those running S corporations and LLCs, the P&L becomes much more valuable once it's used as a planning tool rather than a historical summary.
Why EBITDA matters for owners
A technically rigorous P&L includes EBITDA, which stands for earnings before interest, taxes, depreciation, and amortization. It helps isolate operational efficiency before financing and tax structure distort the picture, as described in Paychex's guide to creating a profit and loss statement for small businesses.
That matters because tax planning works better when you separate operating performance from financing choices. If an S corporation owner wants to understand whether the business itself is strong, EBITDA can help answer that. If a business carries debt, interest expense may depress net income without saying much about the day-to-day strength of operations.
Better tax decisions start with cleaner categories
A messy P&L makes tax planning harder. A clean one makes it easier to spot:
- Whether expenses are classified properly
- Whether overhead is drifting
- Whether operating results support future compensation and distribution decisions
- Whether the business is producing steady earnings or masking problems with irregular items
For owners who need outside guidance, it can help to review broader comprehensive tax solutions for SMBs alongside their bookkeeping and reporting process so tax strategy and financial reporting stay aligned.
Using trends to guide growth
A strong P&L review isn't only about compliance. It informs choices about pricing, hiring, product mix, and expansion.
If gross profit keeps narrowing, you may need to raise prices or revisit suppliers. If operating expenses rise without corresponding revenue strength, you may need tighter discipline before adding staff. If EBITDA improves while net income remains pressured by debt or taxes, that points to one kind of planning. If EBITDA itself is weak, that points to another.
The value is in the pattern. Owners who read those patterns early usually make calmer, better decisions.
A business that understands its numbers tends to move with more confidence. Not because every month is perfect, but because the owner knows what the numbers mean and what to do next.
If you want help turning your P&L into a useful tool for tax planning, bookkeeping clarity, and better business decisions, Allied Tax Advisors can help you organize the numbers, interpret them properly, and build a plan around what they're telling you.