
Calculating depreciation is all about systematically spreading an asset's cost over its useful life. Think of it as accounting for wear and tear over time. The three main ways to do this are the straight-line, declining balance, and units-of-production methods, each giving you a way to record that diminishing value as an annual expense.
Why Depreciation Is a Key Financial Tool

Getting a handle on depreciation is more than just a bookkeeping chore—it’s a powerful tool for gauging your business's financial health. It has a direct line to your profit margins, what you owe in taxes, and how accurate your financial statements are.
Let's say your company just bought a new delivery truck for $60,000. You know for a fact it won't be worth that much a year from now. So, how do you account for that drop in value? That's exactly where depreciation comes into play, giving you a structured way to expense the cost of that truck over its expected lifespan.
The Purpose of Calculating Depreciation
At its heart, depreciation is about matching an asset’s cost to the revenue it helps bring in. This is a bedrock principle of accurate financial reporting. If you were to write off the entire $60,000 for the truck in the first year, your profits would look artificially low. Spreading that cost out gives a much more realistic picture of your company's performance year after year.
Tracking this expense correctly is non-negotiable for accurate financial reporting. For a closer look at how it all fits together, check out our guide on https://alliedtax.com/how-to-prepare-financial-statements/.
Depreciation isn't just about accounting for wear and tear; it's a critical tool for financial planning. It allows businesses to plan for future asset replacements, manage tax obligations, and make smarter investment decisions based on a true understanding of asset value.
A solid grasp of depreciation is also essential when you're building financial models. Sticking to financial modeling best practices ensures your forecasts are built on solid ground, giving you a reliable roadmap for growth.
An Introduction to the Three Core Methods
Let's quickly go over the three go-to methods for calculating depreciation. Each one is designed for different types of assets and business situations.
- Straight-Line Method: This is the simplest and most widely used approach. It evenly distributes the asset's cost across each year of its useful life. It’s perfect for things that lose value at a steady pace, like office furniture or basic equipment.
- Declining Balance Method: This is an accelerated method, meaning you expense a bigger chunk of the asset's cost in its early years. It’s a great fit for assets that lose value fast, like new vehicles or computer hardware.
- Units-of-Production Method: With this method, the depreciation expense is tied directly to how much the asset is used. It’s ideal for manufacturing equipment where wear and tear is a direct result of output, not just the calendar flipping over.
The right method really just depends on the asset itself and your overall financial strategy.
Depreciation Methods at a Glance
To make it even clearer, here’s a quick summary table that breaks down when to use each method.
| Method | Best For | Depreciation Pattern | Complexity |
|---|---|---|---|
| Straight-Line | Assets that lose value evenly over time (e.g., office furniture, buildings). | Consistent and predictable each year. | Low |
| Declining Balance | Assets that are most valuable when new (e.g., vehicles, tech hardware). | Higher expense in early years, lower in later years. | Medium |
| Units-of-Production | Assets whose wear is tied to usage (e.g., manufacturing machinery). | Variable; depends on annual production or usage. | High |
This table should help you quickly decide which approach makes the most sense for any new asset you acquire.
Calculating Depreciation with the Straight-Line Method
When it comes to depreciation, the straight-line method is almost always the best place to start. It’s the most common and intuitive way to account for an asset's loss in value over time. Think of it as the bread and butter of depreciation—it’s simple, predictable, and works perfectly for assets that have a consistent, steady decline in usefulness, like office furniture or basic equipment.
The logic is simple: you expense the exact same amount of the asset's cost each year. This consistency is a huge plus for budgeting and financial planning because it eliminates surprises. Your depreciation expense will be a stable, predictable line item on your income statement, year in and year out.
The Formula and What You'll Need
Before you can crunch any numbers, you need to gather three key pieces of information. Once you have these, the actual calculation is a breeze.
- Asset Cost: This isn’t just the sticker price. It’s the total investment to get the asset up and running. That means you should include the purchase price, shipping costs, installation fees, and any sales tax you paid.
- Salvage Value: This is your best guess at what the asset will be worth when you’re done with it. What could you sell it for at the end of its useful life? Even if you think it'll be worth nothing, you need a number—which could be $0.
- Useful Life: This is how long you expect the asset to be a productive part of your business. It's an estimate, of course. For things like computers or professional camera gear, a five-year useful life is a pretty standard assumption in many industries.
The formula itself is recognized and accepted globally for its simplicity. To find your annual depreciation expense, you just plug your numbers into this:
(Cost – Salvage Value) / Useful Life = Annual Depreciation Expense
For example, say a business buys a piece of machinery for $50,000. They expect it to last for 10 years and figure they can sell it for parts for $5,000 at the end. The calculation would be ($50,000 – $5,000) / 10, which gives them an annual depreciation expense of $4,500. This straightforward approach is a favorite because it's easy to understand and accepted by regulators. For a deeper dive into different methods, resources from financial experts like NetSuite.com are a great place to look.
A Practical Walkthrough: A New Server Setup
Let's see how this works in a real-world scenario. Imagine your company just bought a new server to keep up with its data needs.
The total cost to purchase, install, and configure the server was $25,000. Based on the technology and your company's growth, you estimate it will have a useful life of five years. After that, you could probably sell the used components for about $5,000.
Here's the step-by-step breakdown of the math:
-
Find the Depreciable Base: This is the total amount that will be depreciated. Simply subtract the salvage value from the original cost.
- $25,000 (Cost) – $5,000 (Salvage Value) = $20,000
-
Calculate the Annual Expense: Now, divide that depreciable base by the number of years you'll be using the asset.
- $20,000 (Depreciable Base) / 5 years (Useful Life) = $4,000 per year
So, for the next five years, your company will record a $4,000 depreciation expense for this server. Easy as that.
Putting It All Together in a Depreciation Schedule
To keep everything organized, you'll want to create a depreciation schedule. This table gives you a clear, year-by-year picture of the asset's value as it declines. It’s a must-have for tracking the asset’s book value.
Using our server example, the schedule would look like this:
| Year | Beginning Book Value | Annual Depreciation | Accumulated Depreciation | Ending Book Value |
|---|---|---|---|---|
| 1 | $25,000 | $4,000 | $4,000 | $21,000 |
| 2 | $21,000 | $4,000 | $8,000 | $17,000 |
| 3 | $17,000 | $4,000 | $12,000 | $13,000 |
| 4 | $13,000 | $4,000 | $16,000 | $9,000 |
| 5 | $9,000 | $4,000 | $20,000 | $5,000 |
Notice how the book value drops consistently until it hits the $5,000 salvage value at the end of year five. That’s your sign that the calculation is correct.
A quick pro-tip: The ending book value at the end of an asset's useful life must equal its salvage value. If it doesn't, you'll need to go back and check your math.
This schedule isn't just for your own records; it has a real impact on your financial statements. That $4,000 annual expense goes on your income statement, which lowers your taxable income. At the same time, the accumulated depreciation shows up on the balance sheet, reducing the asset's book value and giving a more accurate picture of your company's financial health.
Shifting Gears: Accelerated Depreciation and the Declining Balance Method
The straight-line method is reliable and easy, but let's be honest—it doesn't always reflect reality. Think about a brand-new work truck or a powerful new computer. They lose a big chunk of their value the second you drive them off the lot or boot them up for the first time.
This is exactly why accelerated depreciation methods exist. The most common one you'll run into is the Double Declining Balance (DDB) method.
It’s a strategy that lets you claim larger depreciation expenses in the first few years of an asset's life and smaller ones as it gets older. This approach is powerful because it mirrors the asset's actual market value more closely, especially for things that become obsolete fast. Plus, front-loading the expense can give you a significant tax advantage by lowering your taxable income right when you need it most.
The Double Declining Balance Formula
At its core, the Double Declining Balance method does exactly what its name implies: it doubles the straight-line depreciation rate. If an asset has a five-year lifespan, its straight-line rate is 20% per year (100% ÷ 5 years). Under DDB, you’d use a 40% rate. This is a go-to method in fast-moving industries like tech, where today's cutting-edge equipment is tomorrow's paperweight.
The formula itself is straightforward:
Depreciation Expense = ((1 / Useful Life) x 2) x Book Value at Beginning of Year
The key difference here is that you apply the rate to the asset's book value at the start of each year, not the original cost minus salvage value. In fact, you ignore the salvage value entirely until the very end.
Real-World Example: A Fleet of Laptops
Let's walk through a scenario. A design agency just dropped $50,000 on new high-performance laptops for its creative team. They figure the laptops will be useful for five years before they need an upgrade, at which point they could probably sell them for about $5,000.
Here's how they'd calculate the first year's depreciation using DDB:
- Find the straight-line rate: 1 ÷ 5 years = 0.20 (or 20%).
- Double it for the DDB rate: 20% x 2 = 40%.
- Calculate Year 1 depreciation: Apply that rate to the initial cost.
- $50,000 x 40% = $20,000
Right off the bat, the agency gets to claim a $20,000 expense. This drastically reduces their taxable income for the year, giving them a much-needed cash flow boost compared to the straight-line method.
The Critical Switch to Straight-Line
Now, here's the part that trips people up. If you keep applying that 40% rate year after year, the math gets weird. You’ll get closer and closer to the $5,000 salvage value, but you'll never actually land on it.
To fix this, you have to make a strategic switch over to the straight-line method. The rule is simple: you switch in the first year that the straight-line calculation gives you a bigger write-off than the DDB method would. This is the only way to ensure the asset depreciates perfectly down to its salvage value without going over.
The secret to mastering the DDB method is knowing when to jump ship. Switching to the straight-line method at the right moment isn't just a suggestion—it's a required step for keeping your books accurate.
Let's see how this plays out for the agency's laptops over the full five years:
| Year | Beginning Book Value | DDB Expense (40%) | Straight-Line Expense | Depreciation Expense | Ending Book Value |
|---|---|---|---|---|---|
| 1 | $50,000 | $20,000 | $9,000 | $20,000 | $30,000 |
| 2 | $30,000 | $12,000 | $7,500 | $12,000 | $18,000 |
| 3 | $18,000 | $7,200 | $5,500 | $7,200 | $10,800 |
| 4 | $10,800 | $4,320 | $5,800 | $5,800 | $5,000 |
| 5 | $5,000 | $2,000 | $0 | $0 | $5,000 |
Look at Year 4. The DDB calculation would have been $4,320. But if we calculate the straight-line expense on the remaining value (($10,800 Book Value – $5,000 Salvage Value)), we get $5,800. Since that's higher, we switch methods and take the larger $5,800 deduction. The book value now hits the $5,000 salvage value perfectly, and we're done.
While DDB offers a great way to accelerate deductions, it's also worth looking into how bonus depreciation works. For certain assets, it can provide an even more substantial first-year tax break.
The Units of Production Method: Tying Depreciation to Actual Use
So far, we’ve focused on depreciation methods that are all about the clock—spreading an asset's cost over a set number of years. But what happens when an asset's value drops because of how much you use it, not how old it is?
For many businesses, especially in manufacturing or logistics, linking depreciation directly to an asset's output gives a much truer financial picture. This is exactly where the units of production method comes in.
Instead of a calendar, you use output. You spread the asset's cost over the total number of units it’s expected to produce, miles it will drive, or hours it will run. This approach is brilliant because it perfectly syncs the depreciation expense with the revenue that asset is helping to generate.
Why Usage-Based Depreciation Just Makes Sense
Picture a company that makes seasonal products. In the summer, their main production machine is roaring 24/7. In the winter, it might sit completely idle for weeks. If they used a straight-line method, they’d record the same big depreciation expense in a slow month as they would in a peak month, which can really skew their profitability numbers.
The units of production method fixes this. You record a higher expense when production is high and a lower expense when things are slow. This gives you a much more realistic match between your expenses and your revenue on the income statement.
First, Calculate Your Depreciation Rate Per Unit
To get this going, you first need a depreciation rate for each "unit" of output—whether that unit is a widget, a mile, or an hour of operation. The formula looks a lot like the one for straight-line, but with a key difference.
The formula is:
(Cost – Salvage Value) / Total Estimated Production Capacity = Depreciation Rate Per Unit
Let’s quickly unpack that:
- Cost: This is the full price of the asset plus any extras like shipping, setup fees, and taxes.
- Salvage Value: Your best guess at what the asset will be worth when you're done with it.
- Total Estimated Production Capacity: This is the big one. It's your forecast for the total output the asset can handle over its entire life.
The real challenge here is estimating that total production capacity. You need solid historical data or reliable specs from the manufacturer to get it right. A bad guess can throw off all your calculations down the line.
A Real-World Example: A Commercial 3D Printer
Let's put this into practice. A design firm buys a commercial 3D printer for $80,000. After setup and delivery, the final cost lands at $85,000. The manufacturer says the machine is rated for a lifespan of 20,000 hours of runtime. The firm figures they can sell it for about $5,000 when it reaches that point.
First, we need to find the depreciation rate for every hour the machine runs.
- Find the Depreciable Base: $85,000 (Cost) – $5,000 (Salvage Value) = $80,000
- Calculate the Rate Per Hour: $80,000 / 20,000 hours = $4.00 per hour
And there we have it. The firm can now expense $4.00 for every single hour that 3D printer is working.
Connecting the Rate to Annual Usage
With this method, your annual depreciation expense is no longer a fixed number. It's a variable that flexes with your business activity. To find the expense for the year, you just multiply your rate by the actual units produced.
Annual Depreciation Expense = Depreciation Rate Per Unit x Units Produced in the Year
Let's follow the 3D printer for a few years to see how this works:
- Year 1 (High Demand): The firm is slammed with projects and runs the printer for 3,500 hours.
- Expense: 3,500 hours x $4.00/hour = $14,000
- Year 2 (Steady Year): Business is good, and the printer runs for a solid 2,800 hours.
- Expense: 2,800 hours x $4.00/hour = $11,200
- Year 3 (Slow Period): A big client pushes back a project, and the printer only runs for 1,200 hours.
- Expense: 1,200 hours x $4.00/hour = $4,800
As you can see, the depreciation expense perfectly mirrors the machine's activity levels. This is the core power of the units of production method—it gives you an accurate, dynamic look at an asset's cost, making it a fantastic tool for any business where value is tied to output, not the calendar.
How to Choose the Right Depreciation Method
Knowing the formulas for depreciation is one thing, but the real skill lies in knowing which method to use for which asset. This isn't just an accounting exercise; it's a strategic decision that directly affects your financial statements, your tax bill, and how accurately you represent the value of your assets.
There’s no single "best" method. The right choice always comes down to the nature of the asset itself and what you’re trying to achieve financially. A company car and an office building don't lose value the same way, so it makes sense that you wouldn't depreciate them with the same logic. Getting this right ensures your financial reporting is both compliant and a true reflection of reality.
This chart really drives home how different your annual depreciation expense can look for the exact same asset, just by changing the method.
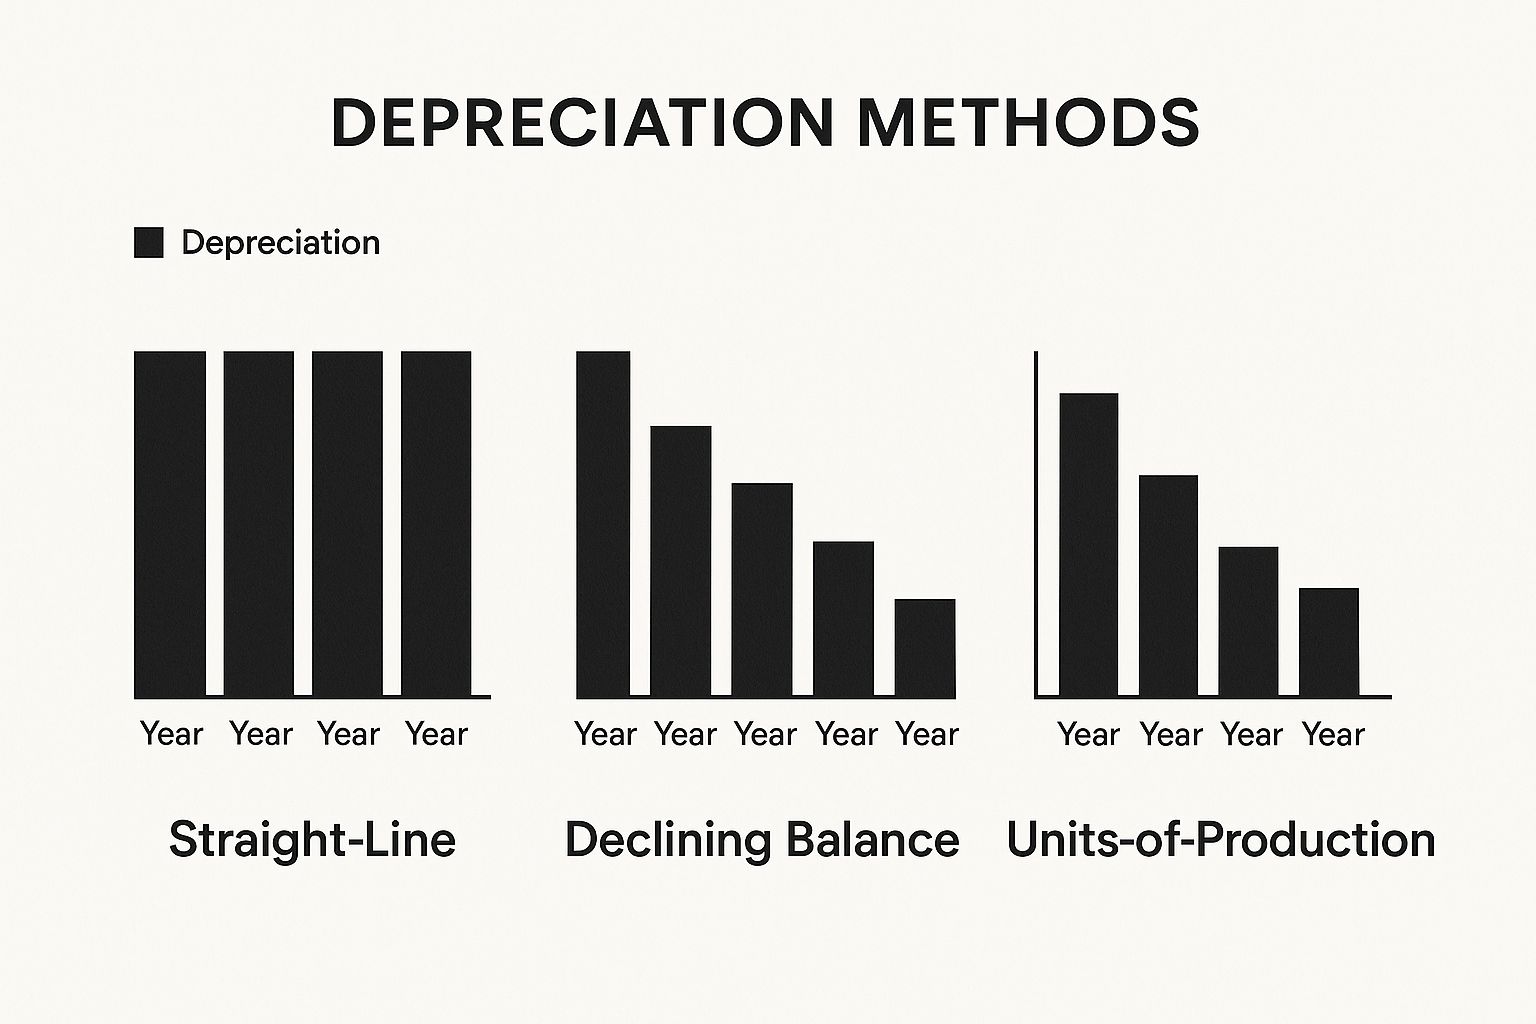
You can immediately see the steady, predictable line of the straight-line method. Contrast that with the big upfront hit from the declining balance method and the unpredictable path of the units-of-production method, which completely depends on usage.
Mapping Assets to the Best Method
The simplest way to decide is to ask yourself: how does this asset actually lose its value?
Does it wear out steadily over the years? Does it lose most of its value right after you buy it? Or does its value drop based on how hard you run it? Your answer will almost always point you to the perfect depreciation method.
Let’s look at some common business assets and where they fit.
-
Straight-Line Method: This is your workhorse for assets that lose value predictably over a long period. Think of things that don't become obsolete or get worn out quickly.
- Good for: Office furniture, fixtures, and commercial buildings. For anyone in real estate, understanding the rules for depreciation on rental property is essential, and for the building itself, you'll almost always be using the straight-line method.
-
Declining Balance Method: This is the perfect fit for assets that are most valuable when they're brand new and take a big value hit early on.
- Good for: Company vehicles, computer hardware, and other high-tech gear. A new work truck loses thousands in value the second you drive it off the lot. An accelerated method is a much more honest way to account for that.
-
Units-of-Production Method: Pick this method when an asset's decline in value is all about usage, not the calendar.
- Good for: Manufacturing equipment like a CNC machine, heavy mining machinery, or even a delivery van where value is tied directly to mileage rather than age.
Choosing a method isn't just an accounting detail; it's a financial strategy. An accelerated method like Double Declining Balance can offer significant tax benefits in the early years of an asset's life by reducing your taxable income when the investment is newest.
Strategic and Financial Implications
The method you choose says something about your financial strategy.
The straight-line method is simple and keeps your financial reports looking predictable. If you want to show stable, consistent earnings year after year, this is often the way to go.
On the other hand, the declining balance method is a powerful tool for tax planning. By front-loading your deductions, you can lower your tax bill now and defer payments, which is fantastic for immediate cash flow. This is especially helpful for new companies trying to conserve every dollar.
The units-of-production method gives you the most precise match between your expenses and your revenue. If your business is seasonal or has unpredictable production cycles, this method prevents depreciation from dragging down your profits during a slow month.
Comparing Depreciation Methods
To make the choice even clearer, this table breaks down the three primary methods side-by-side. Seeing the main features, advantages, and ideal uses all in one place can help you pinpoint the best approach for any given asset.
| Feature | Straight-Line | Double Declining Balance | Units-of-Production |
|---|---|---|---|
| Depreciation Pattern | Consistent expense each year. | Higher expense in early years, lower in later years. | Variable expense based on actual usage. |
| Best For | Assets losing value evenly (buildings, furniture). | Assets losing value quickly (vehicles, tech). | Assets with usage-based wear (machinery). |
| Primary Advantage | Simplicity and predictability for financial reporting. | Maximizes early-year tax deductions and improves cash flow. | Accurately matches expenses to revenue generated. |
| Main Disadvantage | May not reflect the true market value of an asset. | Can be more complex to calculate and manage. | Requires diligent tracking of asset usage. |
Ultimately, your goal is to pick the depreciation method that paints the most accurate picture of your company's financial health. When you align your choice with both the asset's real-world behavior and your business's financial goals, you're practicing smart, effective financial management.
Got Questions About Depreciation? We've Got Answers
Once you get the hang of the basic formulas, you start running into the tricky "what if" scenarios that pop up in the real world. These are the questions I hear all the time from business owners trying to get their books in order.
Let's walk through some of the most common depreciation curveballs and how to handle them.
Can I Depreciate Land?
This one's a classic, and the answer is always a hard no. Think of it this way: land doesn't wear out. It doesn’t become obsolete or get used up like a delivery truck or a computer.
Now, you can absolutely depreciate the things on the land—like the warehouse you built, the parking lot you paved, or the fences you put up. But the land itself is considered to have an infinite life, so it stays on your books at its original cost and is never depreciated.
What If an Asset Sells Mid-Year?
This happens all the time. You sell a piece of equipment in August that you've been depreciating for years. You can't just ignore the depreciation for the current year.
You’ll need to calculate a partial year's worth of depreciation to cover the time you owned it. If you sold it on June 30th, for instance, you'd claim six months, or half a year's, depreciation. You have to log this final expense before you figure out if you made a profit or loss on the sale. It's a crucial step to get the asset's final book value right.
The gain or loss from a sale is simply the difference between what you sold it for and its book value (cost minus total depreciation) at that moment. Skipping that final partial-year depreciation will throw off your numbers and could lead to tax headaches.
What Happens if an Asset's Useful Life Changes?
You made your best guess five years ago that a machine would last for ten. But thanks to great maintenance, it looks like it will last fifteen. Or, the opposite happens, and new technology makes it nearly obsolete after just six years. What do you do?
You don't go back and mess with your old financial records. That's a bookkeeping nightmare. Instead, you adjust from this point forward.
Here’s the game plan for making that change:
- First, figure out the asset's current book value.
- Then, make a new, realistic estimate of its remaining useful life.
- Take the current book value, subtract any salvage value, and divide that new amount by your new estimate for its remaining life.
This gives you your new annual depreciation expense moving forward. It’s a simple, prospective fix that keeps your past records clean and your future ones accurate. In some cases, unexpected events can drastically alter an asset's value. For example, some people need a car value after accident calculator to understand a vehicle's diminished value.
Getting these specific situations right is what separates good bookkeeping from great bookkeeping. When you're not 100% sure, it's always smart to check in with a tax professional.
At Allied Tax Advisors, we simplify the complexities of depreciation, bookkeeping, and tax strategy so you can focus on growing your business. Our team provides the expert guidance you need to make smart financial decisions. Learn how we can support your financial journey at https://alliedtax.com.